Use this price elasticity of supply calculator to calculate the price elasticity of supply (PES) and find the change in the supply of products or services.
PES:
Supply Type:
- Midpoint Price
- Midpoint Supply
- Price Change (%)
- Supply Change (%)
Initial Revenue:
New Revenue:
Difference:
The price elasticity of supply calculator measures how much product supply responds when there’s a change in the price of a good. You don’t need to guess if suppliers can scale up production or stay stuck at current levels; our tool shows you the figures you want to know. Along with elasticity, it also tells how revenue shifts when price and supply move together, because theory is nice, but numbers that pay the bills are more interesting.
- What is Price Elasticity of Supply?
- How to Calculate Price Elasticity of Supply
- Price Elasticity of Supply Formula and Examples
- Price Elasticity of Supply Values
- How to Use the Price Elasticity of Supply Calculator
- Revenue and Turnover Logic
- Short-Run vs Long-Run Supply Elasticity
- Key Factors That Impact Price Elasticity of Supply
- The Importance and Implications of the Price Elasticity of Supply
What is Price Elasticity of Supply?
Price elasticity of supply calculates how much the quantity supplied changes after a change in the product’s price. It focuses completely on the manufacturer side of the market.
If prices rise and suppliers can increase output, supply is elastic, and when prices change, but output barely moves, supply is inelastic. Price elasticity of supply is almost the same as price elasticity of demand. Here, we calculate the movement for supply instead of demand along the curve.
Let’s consider a cloud software company. If subscription prices increase and the company can onboard more customers with almost no extra cost, supply is elastic. Now compare that to a lithium mine—higher prices don’t create new mines overnight. That’s inelastic.
Here are some reasons why price elasticity of supply matters in practice:
- Elastic supply allows businesses to capitalize when a price increase happens.
- If the supply is inelastic, higher prices might not yield much extra output.
- Revenue depends on both price and quantity, not a single factor.
That’s exactly why the PES calculator includes revenue and turnover figures beside elasticity. It tells how flexible quantity is, and revenue shows if that flexibility can help.
How to Calculate Price Elasticity of Supply
Have you ever wondered why your local coffee shop can pump out 500 lattes during morning rush, but your neighborhood plumber needs three weeks to fix a toilet? It’s supply elasticity. In economics, price elasticity of supply tells you how fast suppliers can increase production (percentage for quantity supplied) when the product or service price goes up.
Where:
- % Change in Quantity Supplied = New Quantity – Old Quantity ÷ Old Quantity
- % Change in Price = New Price – Old Price ÷ Old Price
Most people mess this up because the result varies depending on whether prices move up or down (the “base” number problem). If you present a model with that error in a boardroom, you will be in trouble. If the number is greater than 1, supply is elastic—producers can scale up fast. If it’s less than 1, the supply shows inelastic behavior and will be slow. When PES equals 1, that means unit elastic, which is theoretically fine but rare in general.
Let’s say artisanal pickle rates change from $8 to $10 per jar (a 25% increase). The local pickle empire then increased monthly production from 1,000 jars to 1,400 jars (a 40% increase). So,
PES = 40% ÷ 25% = 1.6
That’s elastic supply, and these pickle makers can work according to price signals, possibly because they have spare capacity, available cucumbers, and hard workers who don’t mind overtime.
For digital products, there’s always infinite elastic behavior. Spotify can serve one customer or one billion without any trouble. Though for T-shirt manufacturers, the result is elastic because they have idle machines and fabric suppliers on speed dial.
Moreover, the time period also matters a lot. You can’t ask a wheat farmer to double production next week; they need at least two seasons to grow that amount of wheat. Short-run PES is almost always less than long-term. Businesses need time to purchase equipment, hire workers, secure raw materials, and figure out if this spike in price is real or temporary.
People usually confuse elasticity with quantity. A 10% price increase, causing a 15% more supply demand, doesn’t mean suppliers ask more than buyers need; they are just responsive. When investing, elastic suppliers get squeezed during booms—everyone piles in and floods the market. Inelastic suppliers print money when demand spikes because competitors can’t catch up quickly.
Price Elasticity of Supply Formula and Examples
Theory is fine for the classroom, but on the trading floor, you need the numbers to carry forward. If you can’t calculate this accurately, you will only be making guesses.
Percentage Formula
Use this for mental math in a meeting or when price changes are small (under 5%). It’s fast, but accuracy degrades as the spread widens.
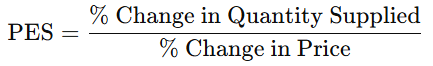
Price Elasticity of Supply (PES) = % Change in Quantity Supplied ÷ % Change in Price
Midpoint Formula
It calculates elasticity over an arc instead of a single point, which means you get the same result whether the price increases or decreases. It also removes base-number bias that silently ruins forecasts and gets junior analysts walked out.
PES = [(Q2 − Q1) ÷ ((Q2 + Q1) ÷ 2)] ÷ [(P2 − P1) ÷ ((P2 + P1) ÷ 2)]
Where:
- Q1, Q2 = Initial and new quantities supplied
- P1, P2 = Initial and new prices
Now, let’s solve a few examples on different real-world cases to get the hang of this finance term.
Example #1
A bakery sells croissants at $3 each and produces 200 items daily. Last month, the shop owner increased the price to $4 for one croissant and scaled up production to 300 pieces every day.
Quantity change: (300 – 200) ÷ 200 = 0.50 or 50% Price change: (4 – 3) ÷ 3 = 0.33 or 33%
PES = 50% ÷ 33% = 1.5
The result is an elastic supply, which makes sense because they have ovens with spare capacity, flour is available in quantity, and bakers are willing to start production very early. They are fine to respond to high prices.
Example #2
Premium wine sells for $50 per bottle. When the demand spikes, the bottle’s prices hit $65, and the vineyard has increased production from 10,000 to 10,500 bottles this year.
Quantity change: (10,500 – 10,000) ÷ 10,000 = 0.05 or 5% Price change: (65 – 50) ÷ 50 = 0.30 or 30%
PES = 5% ÷ 30% = 0.17
Brutally inelastic. You can’t plant more grapevines and harvest next week. The land, climate, and aging process don’t care about your profit margins.
Example #3
A SaaS company charges $100/month with 1,000 subscribers. They changed prices to $120, and thanks to the perceived value increase, they can maintain the subscribers while their server costs barely budge.
Wait—this example breaks the model. Digital products don’t follow traditional supply curves because the marginal cost nears zero. Price elasticity of supply becomes almost meaningless in this case. Just pocket the extra $20,000 monthly.
With slightly different results and the same conclusion, the midpoint method matters more for academic papers than business decisions.
Example #4
Assume the normal driver rate is $30 per hour with 500 drivers active. Surge pricing pushes the rate to $90 per hour, and the number of active drivers rises to 1,200.
Quantity change: (1,200 – 500) ÷ 500 = 140%
Price change: (90 – 30) ÷ 30 = 200%
PES = 140% ÷ 200% = 0.7
Moderately inelastic. Even tripling wages doesn’t get everyone off their couch because drivers have other plans, there’s a finite number of licensed cabs, and some people value their New Year’s Eve more than extra cash.
Price Elasticity of Supply Values
| PES Value | Supply Type | What It Means |
|---|---|---|
| 0 | Perfectly Inelastic | Supply does not change at all |
| 0 < PES < 1 | Inelastic | Supply changes slowly |
| PES = 1 | Unit Elastic | Proportional response |
| PES > 1 | Elastic | Supply reacts strongly |
| PES = ∞ | Perfectly Elastic | Unlimited response at a fixed price |
Unlike demand elasticity, PES is normally positive, which our calculator correctly preserves.
How to Use the Price Elasticity of Supply Calculator
To use the price elasticity of supply calculator, enter these four values:
- Initial price (P₁) – the original price before the change
- New price (P₂) – the updated price after the change
- Initial supply (Q₁) – quantity supplied at the original price
- New supply (Q₂) – quantity supplied after the new price
Once the inputs are filled, click “Calculate Supply Elasticity” to see the output in detail. Behind the scenes, the tool:
- Calculates the average price and supply
- Computes percentage changes using midpoint values
- Divides the percentage change in supply by the price’s percentage change
- Automatically handles edge cases like no change in price or unchanged supply
- Identify the elasticity type (inelastic, elastic, unit elastic, perfectly elastic)
- Shows revenue before and after the price shift to link elasticity with real financial outcomes
There’s no need to select formulas or estimation methods—the calculator is intentionally locked to the midpoint method because it produces the most reliable and unbiased elasticity results for two-point comparisons. Just make sure to enter accurate data, and the tool will do the rest.
Revenue and Turnover Logic
Even though this is a supply calculator, it also calculates:
- Initial revenue = P₁ × Q₁
- New revenue = P₂ × Q₂
- Revenue difference and percentage change
Why include revenue? Because elastic supply doesn’t mean higher profits. If prices go up but output barely increases or costs spike faster than revenue, elasticity alone won’t save you. The tool connects it directly to money in or out.
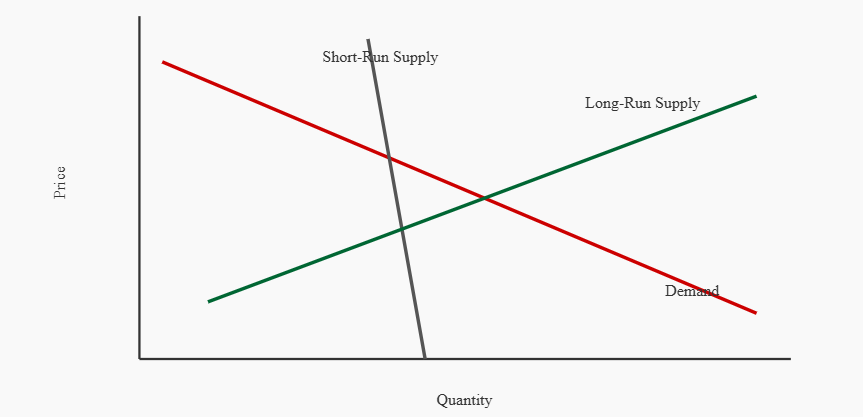
Short-Run vs Long-Run Supply Elasticity
Supply elasticity almost always increases over time.
In the short run:
- Capacity is fixed
- Labor contracts exist
- Equipment can’t be managed overnight
In the long run:
- Firms expand their space or capacity
- New competitors enter the market
- Technology improves productivity
For example, a data center operator won’t be able to double server capacity next week, but over two years? It can. That’s why long-run supply is usually more elastic and why pricing decisions shouldn’t be made using short-term elasticity.
Key Factors That Impact Price Elasticity of Supply
- Production time – When it takes a long time to produce something, producers can’t react fast to price changes. So, supply ends up more inelastic, especially at first.
- Availability of inputs – If producers can easily get materials, labor, or parts, they ramp up output fast. But when inputs are hard to find, quantity can’t keep up.
- Spare production capacity – Companies with extra room in their factories can level up production in a short time. If they’re already maxed out, shipments stay stubborn and slow to change.
- Ease of entry and exit – Getting in or out of the market is another thing. If it’s easy and cheap to start up or shut down, new suppliers can come in fast, and production becomes more flexible.
- Storage and inventory levels – If you can store the goods, the supply can be adjusted properly. Perishable stuff? There’s not much wiggle room there.
- Rules and regulations – Licensing, safety checks, and environmental standards all make it harder for firms to change how much they produce.
- Time period – Over time, supply usually gets more elastic when brands rethink how they work, add capacity, or move resources around, and adapt.
- Technology and production methods – Better technology and smart production methods make it easy and cheap for manufacturers to respond when prices shift. That pushes quanitity to be more flexible.
The Importance and Implications of the Price Elasticity of Supply
Price elasticity of supply plays a major role in how markets respond when prices, costs, or policies change. Its importance becomes very clear when government actions interfere in markets and force adjustments across supply and demand.
Consider the used cars market. When policymakers debate ‘Who pays the sales tax?’, it depends massively on the elasticities of demand and supply. In markets like used cars, where production can’t instantly adjust, the supply curve usually remains steep in the short run. When a sales tax is introduced, the legal responsibility may fall on the seller, but the economic reality is more complex.
The imposition of the tax shifts the supply curve upward, which increases the market price paid by the buyer and reduces the quantity sold. This interaction between the supply curve and the demand curve defines how the tax burden is shared. This split is known as tax incidence, and it rarely aligns with who is required to collect sales tax on paper.
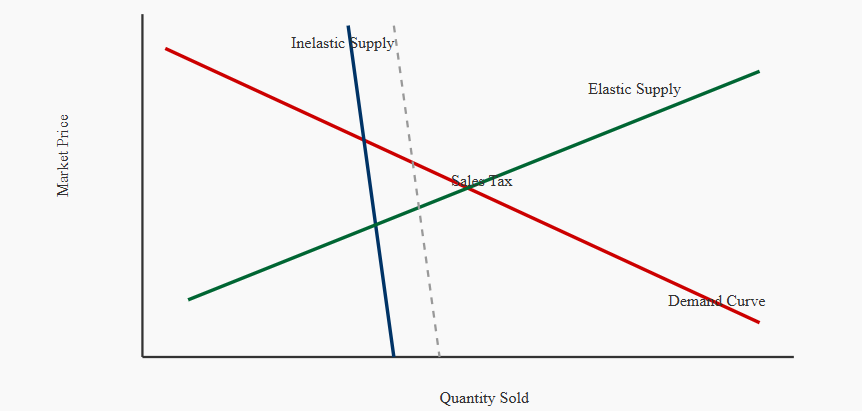
In the used cars market, suppliers mostly cannot reduce output in a short period, which pushes more of the tax burden onto producers. When quantity gets to a perfectly inelastic supply, sellers absorb a larger share of the cost, which results in less producer surplus and a change in market equilibrium. It creates dead-weight loss, where mutually beneficial trades don’t take place, and it shrinks overall economic surplus and weakens the economic state. If such a loss happens over time, we see measurable market distortion, and it affects long-term government revenue from tax revenue sources.
Now, let’s think about a scenario with flexible supply. If there’s a flatter supply curve and producers can adjust output, the maximum adjustment falls on the demand curve. In this case, buyers pay more tax through higher prices, while firms protect margins, and such a distinction explains why used cars have a different reaction to taxation than digital goods or services.
There are also extreme cases. If supply is totally stuck (perfectly inelastic), the amount produced won’t budge, no matter the price. Think rare antiques or the used car auctions with a set number of vehicles. In these situations, taxes mostly just shift money around, but the consumers still lose out.
From a policy perspective, that’s where welfare economics and the economic impact of taxes play their part. If tax policy is poorly designed or there’s an ill-timed excise tax, it won’t take long for the market failure, especially when tax incidence is misunderstood. To implement a better system, there should be accurate market analysis, economic factors awareness, and a clear picture of tax burden distribution.
For businesses, the importance of price elasticity of supply is far beyond taxes. Firms operating under volatile prices must understand how fast a change in supply can occur with increased demand. Basically, if supply is flexible, you can adapt to changes in the market. But if it’s not, you might end up losing profit or missed opportunities.
To improve responsiveness, firms need to invest in flexible capacity, smart production planning, and strong supply chain design. Strategies like overtime, additional employee hires, outsource production, and just in time systems help increase supply and productivity. These choices directly affect costs, inventory management, and resource allocation.
Over the long run, it becomes a competitive advantage to control production capacity and supply chain resilience. If a company aligns its pricing strategy with realistic supply elasticity determinants, it better positions itself for risk management, demand forecasting, and market trend shifts. The purpose is to find the optimal way by which one can manage flexible supply and costs and still protect long-term profitability.
In short, price elasticity of supply connects things like taxes, how much you can produce, and strategic decisions. It’s useful whether you sell used cars or run a huge company, and helps you see how markets react when pressure hits.
Usama, Ali "Price Elasticity of Supply Calculator" at https://zeecalculator.com/price-elasticity-of-supply-calculator from ZeeCalculator, https://zeecalculator.com - Online Calculators